How We Automated Memory Leak Debugging from Hours to Minutes with AI


Memory leak debugging in Android follows a predictable pattern: LeakCanary detects the leak, an engineer spends 2–4 hours analyzing traces and implementing fixes, and the cycle repeats. At Grindr, with multiple teams shipping features across a large-scale app serving nearly 15 million monthly users, we actively prioritize memory management. However, like any complex Android application, memory leaks could emerge as new features are added.
The insight that changed our approach: memory leaks aren’t creative problems requiring human ingenuity; they’re pattern-matching problems. Activity lifecycle issues, Fragment view binding retention, ViewModel coroutine leaks; these follow predictable patterns with established solutions.
Pattern-matching is exactly what AI excels at. So we built an automated system that reads LeakCanary traces, classifies leak types, and applies fixes automatically. The result: significantly faster resolution times and a more manageable memory leak workflow.
Why Android Memory Leak Automation Changes Everything
The traditional memory leak workflow has a fundamental inefficiency: every leak requires the same analytical process, even when the pattern is identical to one you fixed last week.
The Manual Process:
- LeakCanary detects leak and generates trace
- Engineer reads 200+ line stack trace
- Identify leak pattern (Activity? Fragment? ViewModel?)
- Search codebase for relevant files
- Implement fix (onDestroy cleanup, binding nullification, etc.)
- Rebuild, deploy, test, verify
- Repeat for the next leak
Time cost: 2–4 hours per leak
Problem: Steps 2–5 are pure pattern-matching; perfect for automation
The Architecture: Building an AI Debugging Agent
Instead of manually debugging each leak, we built a custom AI workflow that handles the entire resolution cycle.
We implemented this as a custom command (/GrindrFixMemoryLeak) in Firebender, an AI coding assistant for Android Studio. The command is defined in a structured text file that outlines the step-by-step workflow. This approach works with AI coding tools that support custom command definitions through configuration files; whether that's markdown files (.md), rule files (.cursorrules, .mdc), or similar structured formats that different AI assistants use to define reusable workflows.
The Four-Step Automation Workflow
1. Automated Trace Extraction
The agent executes ADB commands to pull LeakCanary logs:
adb logcat -d -s LeakCanary | grep -E "(┬───|GC Root|Leaking: YES)" -A 20 -B 5
This command filters logcat output for LeakCanary traces, capturing 20 lines after (-A 20) and 5 lines before (-B 5) each match to preserve the full leak context.
2. Pattern Classification
AI analyzes traces and classifies by pattern:
- Activity leaks — Lifecycle cleanup issues
- Fragment leaks — View binding retention
- ViewModel leaks — Coroutine cancellation missing
- Singleton leaks — Context retention in long-lived objects
- Third-party leaks — Library-specific issues
Each pattern receives a confidence score (HIGH/MEDIUM/LOW) that determines automation level.
3. Automated Fix Application
For high-confidence patterns, the agent edits files directly:
// ❌ BEFORE: Fragment leak patternclass ProfileFragment : Fragment() { private var binding: ProfileBinding? = null override fun onDestroyView() { super.onDestroyView() // binding not cleared → leak! }}// ✅ AFTER: AI-applied fixclass ProfileFragment : Fragment() { private var binding: ProfileBinding? = null override fun onDestroyView() { super.onDestroyView() binding = null // ← AI added this line }}
4. Build-Deploy-Verify Cycle
The agent automatically:
- Clears previous LeakCanary traces
- Rebuilds the application with Gradle
- Deploys to connected device
- Prompts engineer to reproduce the scenario
- Re-checks for new leaks
- Reports success or identifies remaining issues
Under the Hood: How the AI Reads LeakCanary Traces
The core challenge is teaching the AI to parse unstructured LeakCanary output. Here’s what a typical trace looks like:
┬───│ GC Root: System class├─ android.view.inputmethod.InputMethodManager class│ Leaking: NO (a system class)│ ↓ static InputMethodManager.sInstance├─ android.view.inputmethod.InputMethodManager instance│ Leaking: NO (InputMethodManager is a singleton)│ ↓ InputMethodManager.mNextServedView├─ androidx.appcompat.widget.AppCompatEditText instance│ Leaking: YES (View.mContext references a destroyed activity)│ ↓ AppCompatEditText.mContext╰→ com.grindr.android.ProfileActivity instance Leaking: YES (Activity#mDestroyed is true)
Our AI agent extracts three key signals:
- The leak root: What object is holding the reference? (
InputMethodManager.mNextServedView) - The leaked object: What shouldn’t still exist? (
ProfileActivity) - The leak path: How are they connected? (
mContext reference)
With this structured data, the agent classifies the pattern: “Activity leaked through View reference retained by system singleton”; a HIGH confidence pattern with a known fix (ensure views don’t outlive Activity lifecycle).
Common Fix Patterns Applied Automatically
Fragment View Binding Leak:
override fun onDestroyView() { super.onDestroyView() _binding = null // Added automatically}
Activity Context in Singletons:
// Before:Fresco.initialize(context, config)// After:Fresco.initialize(context.applicationContext, config)
ViewModel Coroutine Cleanup:
override fun onCleared() { super.onCleared() viewModelScope.cancel() // Added automatically }
Pattern Classification & Confidence Scoring
Not every leak should be fixed autonomously. Our decision framework balances automation speed with safety:
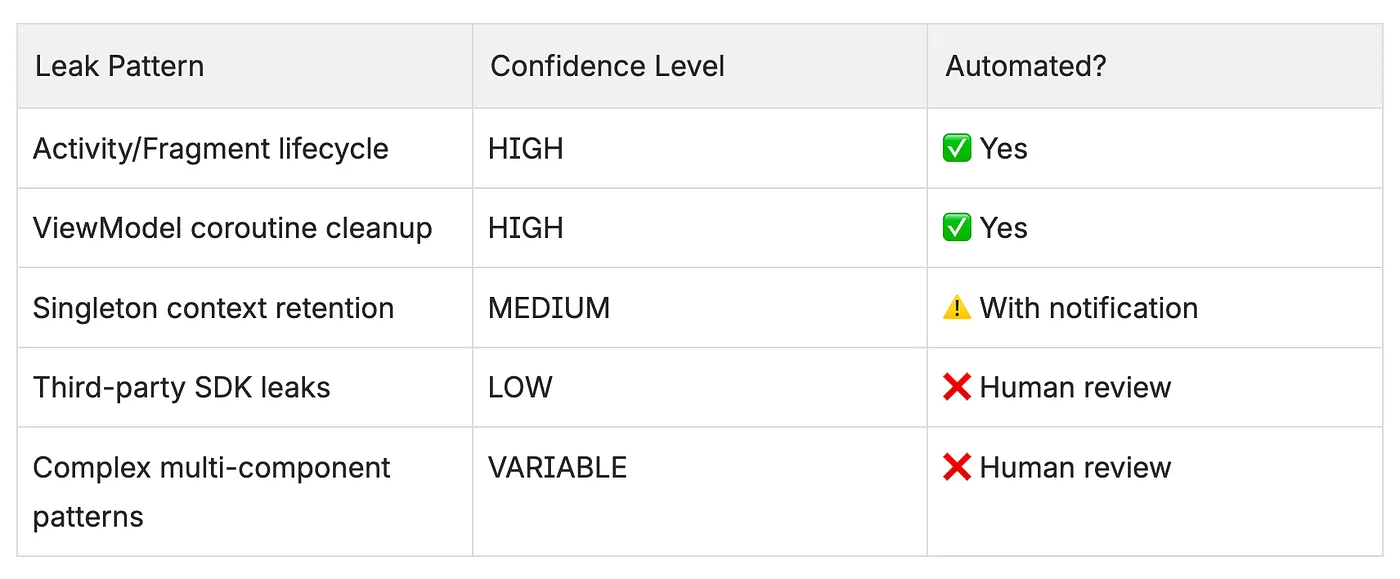
HIGH confidence — Standard lifecycle patterns with proven fixes. Applied automatically without approval.
MEDIUM confidence — Common patterns but may have architectural implications. Applied with engineer notification.
LOW confidence — Unusual patterns, third-party library issues, or fixes requiring >50 lines of code. Requires explicit approval.
This tiered approach ensures routine leaks resolve instantly while complex cases get expert review.
The Impact: Transforming Memory Leak Resolution
Since deploying this automation, the workflow transformation has been significant:
The Change in Practice
Manual debugging meant each memory leak required:
- Reading and interpreting LeakCanary traces
- Searching through the codebase for relevant files
- Analyzing the leak pattern and determining the fix
- Implementing the solution
- Testing and verification
- Time investment: Hours per leak
Automated resolution now handles:
- Immediate trace extraction and analysis
- Pattern classification with confidence scoring
- Automated fix application for high-confidence patterns
- Build and deployment verification
- Time investment: Minutes for routine leaks
Real Benefits
Faster resolution cycles — What previously took hours of manual debugging now completes in minutes for pattern-based leaks, allowing engineers to maintain focus on feature development.
Consistent fix quality — The confidence-based approach ensures standard patterns receive proven solutions, reducing the variability in fix quality that comes with manual implementation.
Reduced context switching — Engineers no longer need to drop feature work to spend hours debugging memory leaks. High-confidence patterns resolve automatically with minimal intervention required.
Common Patterns Successfully Resolved
Based on documented fixes in our codebase, the automation effectively handles these recurring Android memory leak patterns:
Context Retention in Long-Lived Objects
- Library initialization with Activity context instead of Application context (e.g., Fresco, image loaders)
- Singleton components holding Activity/Fragment references
- Third-party SDKs retaining lifecycle-bound contexts
Observer and Callback Patterns
observeForeverwithout proper removal in ViewHolders and Fragments- Strong callback references in managers and delegates (fixed using
WeakReference) - Permission delegates holding strong references to Activities
ViewModel and Repository Patterns
- Singletons retaining ViewModel state through function references
- Flow subscriptions managed outside ViewModel scope
- Lambda captures leaking view or context references
Compose Integration
AndroidViewcomposables lackingDisposableEffectcleanup- Native ad views not properly detached from parent ViewGroups
- View references retained after composition exits
Fragment and Activity Lifecycle
- Direct Fragment references preventing garbage collection (fixed using
Provider<Fragment>) - Dialog references not cleared in
onDestroy - View binding not nullified in
onDestroyView
How We Use It: Continuous Memory Management
The /GrindrFixMemoryLeak command has become a standard part of our development workflow. When LeakCanary detects a leak during feature development or testing, engineers invoke the command and let the AI handle the routine analysis and fixing. For minimal context switching, the command can be run as a background agent in Firebender, allowing engineers to continue working on features while the leak analysis and fixing happens asynchronously.
Integration with Development Workflow
During Feature Development
- Engineers run debug builds with LeakCanary enabled
- When leaks are detected, invoke
/GrindrFixMemoryLeak - High-confidence patterns resolve automatically
- Engineers review and approve low-confidence cases
Continuous Refinement Through Documentation
- The more leaks we resolve and document, the more knowledge the command has to reference
- Each documented pattern becomes a reference for future similar leaks
- Our internal documentation of common patterns and solutions directly improves the command’s effectiveness
- The AI agent references this accumulated knowledge to classify and fix new leaks more accurately
What Makes It Effective
The key to success isn’t just the automation; it’s the structured approach to leak classification and the confidence-based decision framework. By explicitly defining what patterns we trust the AI to fix autonomously versus which require human review, we maintain code quality while eliminating repetitive debugging work.
Key Learnings
After months of automated memory leak resolution, these principles have proven critical:
1. Pattern-based leaks are automatable
Most common Android memory leaks (Activity lifecycle, Fragment binding, ViewModel coroutines) follow predictable patterns with established solutions. These are perfect candidates for AI automation.
2. Confidence-based automation is critical
Not all leaks should be fixed autonomously. Complex cases, third-party library issues, and architectural changes require human review. The confidence scoring system prevents the AI from making risky changes.
3. End-to-end verification is essential
Automated fixes must be validated through full build and test cycles. Without verification, you’re trading manual debugging for manual rollback of bad fixes.
4. Structured prompts enable AI effectiveness
Success comes from encoding your debugging process systematically into the command prompt, not from hoping the AI “figures it out.” Be explicit about steps, decision points, and confidence thresholds.
5. Time savings compound quickly
Saving 2–4 hours per leak seems modest until you realize you’re fixing 10+ leaks per month. That’s 20–40 hours monthly; half an engineer’s time recovered for feature development.
Beyond Memory Leaks: Expanding AI Agent Usage
Memory leak automation demonstrated the value of AI agents for pattern-based development tasks. We’ve since expanded to other repetitive workflows:
Currently in Production:
- Unit test generation — Automated Kotest test creation from class signatures
- PR description generation — Structured pull request documentation based on code changes
Exploring Next:
- Code review assistance — Automated validation of architecture patterns and best practices
- Composable optimization analysis — Identifying unstable composables to prevent unnecessary recompositions
The pattern is consistent: identify repetitive tasks that follow established rules, encode those rules systematically, and let AI agents handle the routine work while engineers focus on complex problem-solving and feature development.
Conclusion
The traditional approach to memory leak debugging; manual trace analysis, manual fix implementation, manual verification; is fundamentally inefficient for pattern-based problems.
By automating the routine parts (trace extraction, pattern classification, fix application, verification) and escalating complex cases for human review (confidence-based decision framework), we significantly improved our leak resolution workflow and reduced the time engineers spend on repetitive debugging tasks.
The shift required changing how we think about AI tools. Instead of “smart autocomplete,” we built a specialized debugging agent with a structured workflow, clear decision points, and end-to-end automation from detection to verification.
The result: engineers spend less time debugging memory leaks and more time building features. Our crash-free rate improved. And when LeakCanary does catch a leak, routine patterns now resolve in minutes instead of hours.
That’s the difference between treating AI as a productivity booster and treating it as a specialized tool for automating entire classes of problems. One makes you type faster. The other eliminates the problem entirely.
Resources
Tools we used:
- Firebender — AI coding assistant for Android Studio (Plugin)
- LeakCanary — Memory leak detection library by Square
- ADB (Android Debug Bridge) — For trace extraction and deployment


.jpg)


.webp)