Optimizing Grindr's UI Performance: Tracking Frame Rate with Firebase Performance Monitoring

Frame rate, AKA Frames Per Second (FPS), is one of the most important metrics to quantify your app’s fluidity on UI performance.
You might have seen this in your logs. If the main thread is busy, the FPS might drops. Dropping some frame seems to be not a big deal, but it’s a warning because it might becomes an ANR on a slower device.
To track frame rate for an app, Firebase Performance Monitoring provides a solution to trace your frame rate for each activity. The metrics will be listed in FirebaseConsole/Performance/onDevice/Rendering
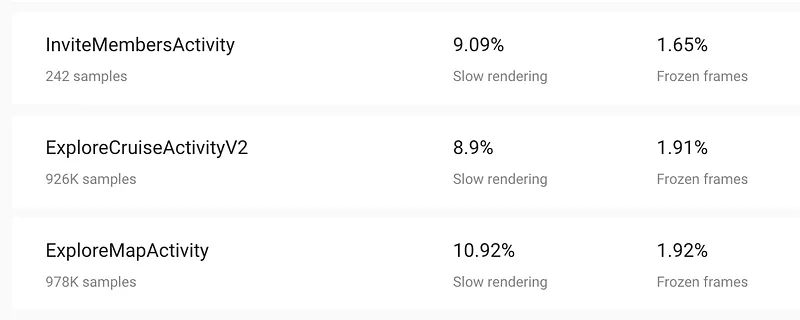
But what if I’m using a TabLayout in my HomeActivity, And it contains several Fragments? Simply telling me “HomeActivity has 50% slow rendering” does not help because it might because of one, or many, fragment in HomeActivity is slow.
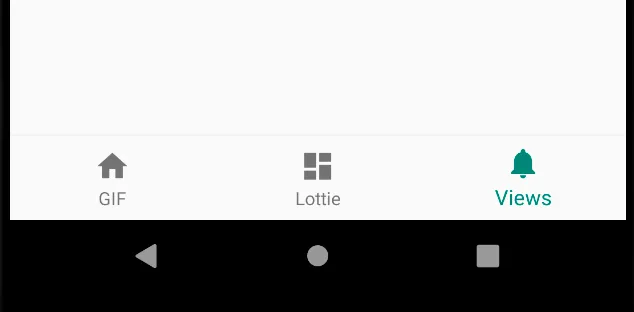
Fortunately, Fragment is a lifecycle component. We will introduce how to use FrameMetricsAggregator to collect metrics in Fragments properly.
So the plan is :
- Create a
BaseFragment, extended by interestedFragments - Create a
TracerinBaseFragment - Start and Stop the
Tracerat proper timing.
- You can get the project from here : GitHub/AndroidFramerateSample
Dependency required
// this project requires :implementation 'org.jetbrains.kotlinx:kotlinx-coroutines-core:1.3.2'implementation 'androidx.lifecycle:lifecycle-extensions:2.2.0'implementation 'androidx.lifecycle:lifecycle-runtime-ktx:2.2.0'
1. Create a BaseFragment
Beware that the data-collecting window is not from onCreate() to onDestroy() . It starts when Fragment is VISIBLE and terminated when Fragment is INVISIBLE. So we design an interface for tracer to know when it should Start/Stop collecting the data.
2. Create a TracerScope
And here is the base of FragmentFramerateTracer scope.
Inside the scope, we should provide start() and stop() to collect the data.
The start() is nothing but adding our activity aggregator , for details of FrameMetricsAggregator, please see here.
In the stop() , we call data = aggregator.stop() to get the data contains distribution.
distribution = data[FrameMetricsAggregator.TOTAL_INDEX] is a sparse array.
For example, if distribution[42] = 5 means there are 5 frames took exactly 42 ms to render. So we go through all durations from 0 to the end, and accumulate the numbers to corresponding variables. Then put it to a simple data class:
3. Start and Stop the Tracer
The tracer is served, it’s time to register the tracer to BaseFragment.
Create a extension for MyBaseFragment like
fun MyBaseFragment.registerTracer() { val tag = "Tracer${this::class.java.simpleName}" var tracer: FragmentFramerateTracer? = null ...}
Remember we need to :
tracer.start()when Fragment is Created or no longer hiding.tracer.stop()when Fragment is Destroyed or been hidden.
So we can create a onHiddenChangedListener like the piece above. And in corresponding Lifecycle stage, we not only calls tracer.start() & tracer.stop , but also add/remove the onHiddenChangedListener
That’s it, the full extension looks like <THIS>
And now we can registerTracer() in onCreate() of MyBaseFragment
override fun onCreate(savedInstanceState: Bundle?) { super.onCreate(savedInstanceState)registerTracer() // Like this}
Everything is settled,
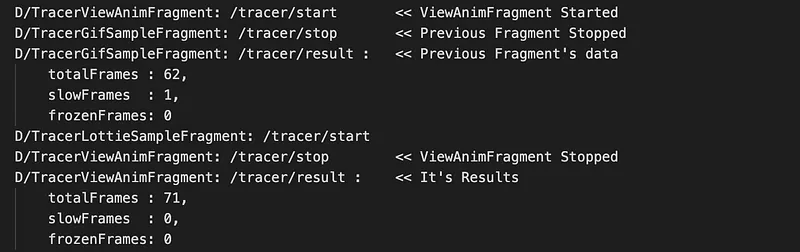
Just run and see the Metrics in Logcat, here’s a sample log with some comments, hope it helps.
GitHub Project : https://github.com/Wesley-Ong/AndroidFramerateSample


.jpg)


.webp)